This is in partial answer to LTG's post below.
One historical comparison to the U.S. situation in Iraq might be the British situation in Northern Ireland (N.I.). In both cases, a military force was sent in to support a government against insurgent/terrorist attack. In both cases, disarmament of local militias and holding elections was considered a sign of success. In both cases, religious violence played a major role, although resistance to what was perceived as an "occupation" was itself an obstacle to peace. Some of the differences, of course, are that Iraq was a much larger operation in a much larger nation over a much shorter timeframe, and Operation Iraqi Freedom (OIF) began with the invasion and overthrow of a sovereign nation.
Forces: Iraq, 138,000 U.S. "baseline"; N.I., 8,000 U.K. + 7,500 N.I. Police
Population: Iraq, 26 Million; N.I., 1.7 Million
Duration: Iraq, 2.5 years; N.I., 36 years
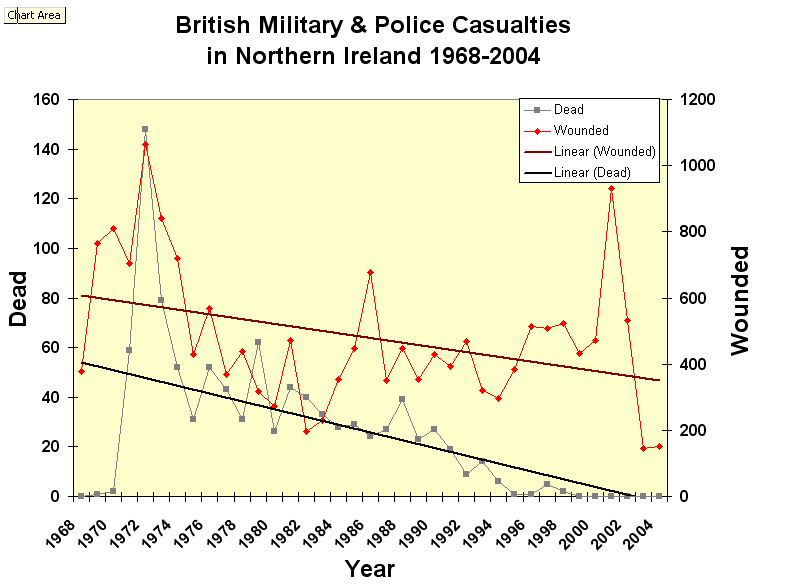
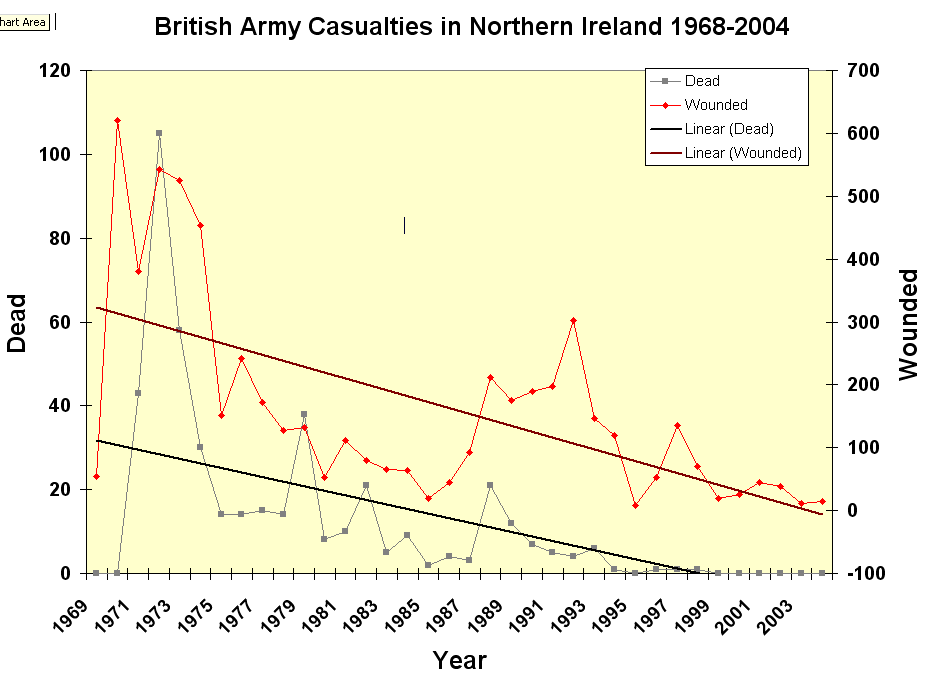
It should be noted that U.K. troops increased over the first few years, so the figure of 10,000 is just an average estimate; the police figures also varied. I have included the N.I. police (Royal Ulster Constabulary) in one graph, while in the last graph I have included only the British Army. You can decide which comparison you feel is more appropriate... the trends are similar enough for my purposes.
The take-home message: you can tell when a stability and support operation (SASO) is succeeding because the casualties decrease with time. Pretty obvious, really. (This is certainly not necessarily true of a major combat operation [MCO] however, as LTG has shown elegantly in his charts.)
[Iraq data from icasualties.org as compiled from Official U.S. Department of Defense statistics. Graph (c) Dr. Strangelove.]
[Northern Ireland data from Official Police Service of Northern Ireland (formerly Royal Ulster Constabulary) Statistics. Graphs (c) Dr. Strangelove.]
Thursday, December 22, 2005
Measuring Success in Stability and Support Operations
Posted by Dr. Strangelove at 8:19 AM
Subscribe to:
Post Comments (Atom)
2 comments:
Are dead and wounded counted separately? You could die of wounds. I ask because if you notice in Strangelove's graph, the wounded and dead lines trace each other. In the Similar graph on the UK, you don't see that tracing. I find that interesting. This may mean that while the numbers may be lower, the lethality of the attacks is greater.
// posted by USWest
The dead are counted in the month they die and the wounded are counted in the month they are wounded. So it may happen that deaths from a single attack appear in a later month. In Iraq, it is also true that lethal attacks have become fewer but more lethal. They are getting more efficient at killing us.
Post a Comment