Here is the tax/income chart Bob and RbR requested (if I understood their request correctly). What I have plotted in this graph is the relative excess share of taxes paid by the upper percentiles, (Tax Share - Income Share)/(Income Share), where the "share" is a fraction or percentage of the whole. I have included data for the 25th percentile as well.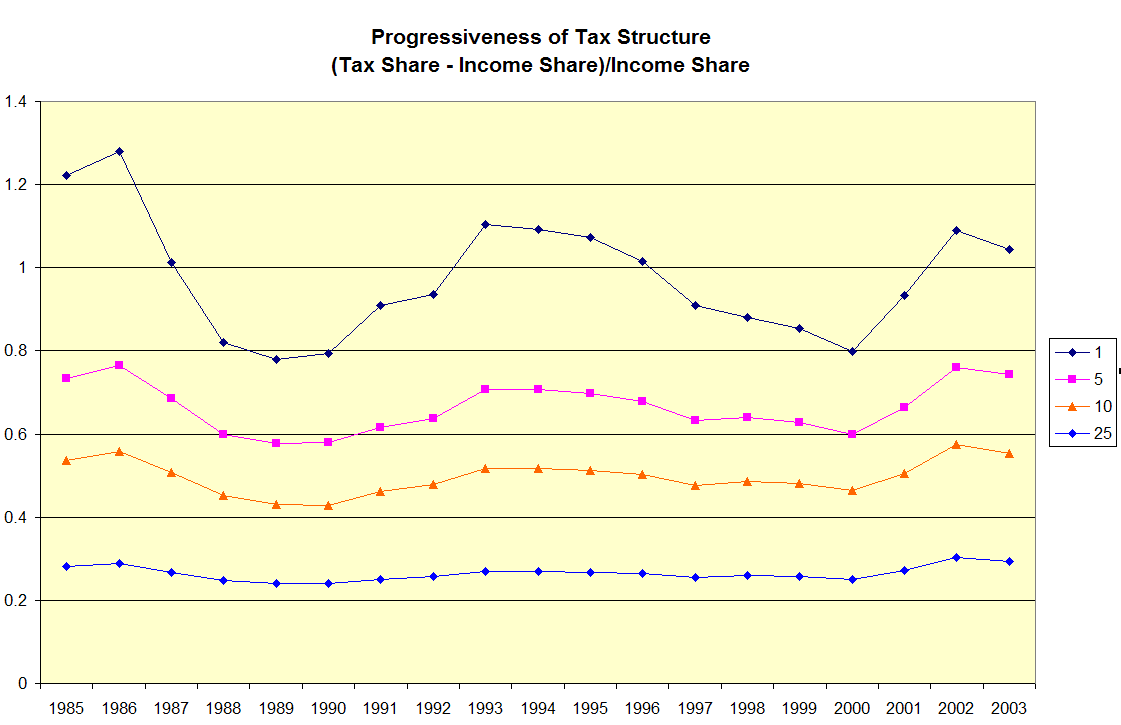
(Click to enlarge image.) I find this graph difficult to interpret. Perhaps the requestors have some insight?
Tuesday, May 02, 2006
Chart Request
Posted by Dr. Strangelove at 10:46 PM
Subscribe to:
Post Comments (Atom)
4 comments:
Well, the flattening and lowering as you take larger and larger percentiles makes obvious sense. (Both the income share and the tax share are going toward 100%, so the difference is going to 0).
Most striking is that even for the top 10%, the graph is pretty close to flat -- this indicates to me that taxwise, having Reagan/Bush or Clinton in office didn't make too much difference in terms of how much taxes the rich are paying. (In other words, the flatness of the graph is reiterating Strangelove's original point.)
If one wanted to read a lot into the graphs, you could note that regression (or reduction in progressiveness) seems to come _before_ a recession, which is followed by a period of increased progressiveness.
The increased progressiveness after a recession is probably expected in some sensible way -- the lower incomes lose out the most, or something like that (economist types can say something more coherent than me here).
The decreases in progressiveness _before_ a recession might mean nothing (having only two data points). Or it might mean something to do with overspeculation of wealth or something, I don't know.
I'm a little suspicious of these justifications, though, both because of the few data points and the difference in time scales -- the oscillation in progressiveness is quite slow, relative to the period of recession. Of course, if I knew what I was talking about, I'd probably complain about the definition of recession vs. "slowdown" -- there might be a different way of measuring economic health that correlates very well with this progressiveness metric.
// posted by Bob
Well, this is probably no more than interesting exercise in mental masturbation. And I am probably blathering here more than anything. I am not sure I understand what this is showing, myself, largely because I don't understand what the Y axis is supposed to be. Is that a measurement of progressiveness? Is it a percentage? So I assume that when the lines go up, the tax structure is more progressive . Is that correct?
I think having some understanding of the tax structure we have would help. First, for readers who aren't familiar with the terminology, in a progressive tax system, the more you earn, the higher your average tax rate. In a regressive tax system, the less you earn, the higher your average tax rate. How rapidly the tax rates rise with income determines the degree to which the income tax is progressive.
When a family earning $60K a year paid $6,000 in taxes, they have paid 10% of their income in taxes. This 10% is the average tax rate (ATR). In a progressive system, a family earning $100K would have to pay a larger percentage of their income in taxes, and thus they would have a higher ATR. However, with tax incentives and deductions, what each individual pays will vary widely. That is why you look t ATR.
On the first graphic in our previous post, Bob was looking at the vertical distance between the lines, i.e. differences in what the top 1% were paying in relation to the top 5% and the top 10%. He was trying to get a bead on the progressively of the system in practice. The first graphic showed that in recessions, incomes fall for everyone.
If I am reading this right, as lines rise, the progressiveness is growing. As they fall, so does the progressiveness. Whatever we are seeing here in relation to taxes, it would appear that not much changed for anyone but the top 1%. The top 1% is the most volatile. But they are also the most exposed to the vagrancies of the marketplace since they are usually the biggest investors, the most exposed to nifty tax advice, and the most likely to have deductions and the most likely to be rewarded by politicians. So of course, they will see the biggest changes.
Of course, we don't have a progressive system, but a graduated system where different levels of income are taxed differently throughout the year. So you get taxed 10% for anything up to say $15K and at 25% for earning $15,001 to say $60K, etc. That really messes things up.
I am not sure I would just hinge things on recessions. Booms and busts will have potentially dramatic effects on income. But I also think you have to look deeper at what was going on with tax codes. You see the biggest changes for the top 1% in periods where the tax code was being fiddled with. In 1981, Reagan gave huge tax breaks that he slowly had to rescind until 1986. From 1985-1989, Reagan set to simplifying the tax code by closing loopholes and ending deductions. Now look at this period on the graphic. You see a huge change. Bush I had no tax policy except that he had to eventually raise taxes. Bush Sr. and a Democratically controlled Congress reached a compromise on a budget package that increased the marginal tax rate and phased out exemptions for high-income taxpayers. Once Clinton took over in 1993,you start to see a rise again in the top 1% line. Clinton was more conservative than people are willing to admit, which is why the changes are not dramatic. But he did raise taxes on the wealthiest of citizens and introduced a lot of tax incentives into the tax code. But, he lost Congress to the Republicans in 1994. And guess what, you start to see a down turn in the 1% line.
As usual, Bush Jr. is an odd mix of things. By 2001, you had a Republican Congress. He seems to break the trend altogether. Here you have a combination of recession with a guy who wants to cut taxes to stimulate growth. This makes him a little like Reagan in that regard. He says that tax reform is on the top of his list. So I, like Bob, am not sure what to make of that. My only thought would be that the housing bubble is somehow skewing things.
Actually, I'd be more interested in seeing just the tax share - income share. I'm not sure what taking that difference and dividing by income share again does.
The difference of tax share - income share would tell us how progressive the tax regime is...I think.
// posted by Raised By Republicans
Yes, the difference (tax share - income share) gives a measure of progressiveness. The ratio just scales things conveniently (for me, anyway).
This was my reasoning in asking for (tax share - income share)/(income share):
Let's call the total tax revenue T, and the total income (or production, or GNP, or other measure of what's getting taxed) G. Then the "average tax rate" is T/G; this is the rate that everyone (and every dollar) would be taxed if there were a perfectly flat tax.
Now consider an income band, say the top n% of the population. They pay some percentage (let's say j) of the taxes, and make some other percentage (let's say k) of the money. So their tax rate (the average tax rate for the band) is (jT)/(kG), or (T/G)(j/k).
So one way to measure progressiveness is to look at that ratio, j/k; if it's 1, then to people in that percentage band, it's like a flat tax. If j/k > 1, it's progressive, and if j/k < 1, it's regressive.
But I like the difference, j-k, and we can measure the progressiveness using the difference by asking: how does the tax rate that the band is paying compare to what they'd be paying for a flat tax?
In other words, what is the difference between the average tax rate for a band and the average tax rate for the whole population? That's
(jT)/(kG) - T/G, or (T/G) [(j-k)/(k)].
The fraction (j-k)/(k), or (tax share-income share)/(income share), is zero for a flat tax. At the extremes, if the band pays _no_ taxes, the fraction is -1. (For a high band, this would be an ultra-regressive tax). If, on the far other hand, this band pays ALL the taxes, the fraction is (1/k) - 1.
[Incidentally, for a "top n%" band, by definition, k >=n (and k=n only if everyone has the same income). So this gives an upper limit on (j-k)/(k), namely (1/n)-1.]
So this is the source of asking for that fraction: the difference (j-k) seemed to be saying something about the progressiveness, and the fraction (j/k) clearly said something about the progressiveness, and put together as (j-k)/k, you get a measure of progressiveness that's bounded and factors out T/G, the "tax burden" on the economy.
I hope that helps explain my rationale -- math doesn't always translate well onto the web.
// posted by Bob
Post a Comment